Why is SPC important for me?
|
SPC is important to you because you want to give your customers good quality products and services.
Inspection cannot build Quality into a product or a service. The process producing it needs to be capable to deliver good quality.
Quality is thus built into a product or a service through Process Assurance. Statistical Process Control (SPC ) brings you a well defined method of assuring Quality of a Process and monitoring the stability of a good process over a period of time.
SPC helps you bring about Process Assurance and in turn a good Quality in what you do.
SPC WorkBench software from SymphonyTech takes you through the scientific workflow of SPC, and firmly guides your efforts towards delivering good quality in all that you make and do.
|
What aspects of SPC does SPC WorkBench cover?
|
SPC WorkBench addresses both, Variable as well as Attribute SPC.
Variable Quality parameters are the ones that you measure and assign a numerical value to. Fill Weight, Part length, Voltage produced by a circuit are examples of Variable type parameters.
Attribute parameters are ones that count defects or classify a product as defective or non-defective.
Under Variable SPC, SPC WorkBench addresses the following:
- Process Capability: Histograms, Normal Probability Plot, Process Capability indices Cp/ Cpk, Pp/ Ppk, CR and PR and calculation of PPM based on the Process Capability indices.
- Control Charts: X-bar/ Range, X/ Moving Range, X-bar/ Sigma charts, with Out-of-Control warnings and Western Electric rules for trend detection.
Under Attribute SPC, SPC WorkBench addresses the following:
- p Chart for fraction defectives
- Np Chart for number of defectives
- c chart for number of defects
- u chart for number of defects per unit.
All charts come with a feature of defect classification. In case defect classification is reported, a Pareto Chart for defect classification and action prioritization is also displayed.
|
What are the Variable Control Charts supported by SPC WorkBench? How do I use them?
|
Variable Control Charts supported by SPC WorkBench are:
- X-bar/ Range Chart: typically used where the sub-group size is between 2 to 6
- X-bar/ Sigma Chart: typically used where the sub-group size is 7 or above
- X/ Moving Range Chart: used when the sub-group size in 1
Control Charts are indicators of stability. Once a process is established and runs under a steady state, Control Limits should be applied on the Control Chart. These are limits of natural variation for the Control Chart. So long as the subsequent points plotted on the Control Chart lie within the Control Limits, the process can be assumed to be running in a stable manner.
If the X or X-bar Chart shows a point out of control limits, you need to investigate reasons for the drift of the process aim, correct it and then resume the process.
If the Range or Sigma Chart shows a point out of control limits, you need to investigate reasons for excessive variation that may have crept into the process.
Control Charts tell you when you need to investigate the process and tweak it, and when to leave it alone.
|
When do I apply Control Limits on a Chart? When do I need to re-calculate Control Limits?
|
Control Charts help to monitor stability of a process over a period of time. Typical workflow of using a Control Chart is as follows:
- Collect data in sub-groups and start plotting a Control Chart.
- When you believe that the process under monitoring has attained stability, apply Control Limits. This should be done typically after plotting at least initial 25 sub-groups of data. We call these the Process Study sub-groups.
- Control Limits are established based on the variation that is seen in these initial Process Study subgroups.
- To assure yourself that the Process is Stable and is working satisfactorily, verify that:
- All the Process Study points on the Control Chart fall within the Control Limits.
- The Process Capability Index Ppk for the Process Study data collected is satisfactory.
- These Control Limits applied should be carried forward. Continued stability of the process should be verified against these Control Limits.
In course of running the process, there will be instances where a process improvement is made. The improved process will now run with a better repeatability. It would be prudent in such cases to re-apply control limits on the Control Charts based on the improved process horizon. The Control Chart will now monitor the process stability correctly for the improved process.
|
What are the Attribute Control Charts supported by SPC WorkBench? How do I use them?
SPC WorkBench supports the following Attribute Control Charts:
- p Chart for fraction defectives
- Np Chart for number of defectives
- c chart for number of defects
- u chart for number of defects per unit.
Control Charts indicate stability of the process and warn whenever external assignable causes creep into the system.
All charts come with a feature of defect classification. In case defect classification is reported, a Pareto Chart for defect classification and action prioritization is also displayed.
What does a Histogram and various other Process Capability indices tell me?
A Histogram is plotted for Variable type quality data. A histogram is a frequency distribution that visually displays the process aim and process variation.
Observe the histogram to confirm that it has a single peak and two tails. This is an indicator of a process running under natural causes. A bimodal or multimodal histogram ( a histogram with two or multiple peaks ) is an indicator of a drifting process or that the process under evaluation is a mix of multiple distinct independent streams. A unimodal histogram (one with a single peak and two tails) gives you the ability to predict Process Capability.
Process Capability Indices of Cp/ Cpk, Pp/Ppk enable you evaluate whether the process is capable of meeting specifications.
- Pp: Is the Process Performance index. It tells you how much variation the process has been showing in the past as compared to the process variation tolerated by the specifications.
- Ppk: Is the Process Performance index that takes into account the process centering.
- Cp: Is the Process Capability Index that predicts how much variation the process would show in the future as compared to the process variation tolerated by the specifications.
- Cpk: Is the Process Capability index that takes into account the process centering.
Quoting Don Wheeler, Cp and Cpk indices that are evaluated from a stable process have the ability to predict whether the process would produce acceptable output if it keeps running as it did. Pp and Ppk indices simply report what the process has been doing in the past.
The strength of these indices tells you how good the process is to meet the specifications. A popular guideline in the industry says that a Process Capability Index should be better than 1.33 for a process to be deemed good.
Does SPC WorkBench support unilateral tolerances?
SPC WorkBench supports unilateral tolerances. There are parameters such as surface roughness, position, concentricity and runout which have only the upper bound as their specification. Parameters such as breaking strength have only their lower bound as their specification.
While representing such tolerances in SPC WorkBench, you need to define only the available specification limit. The other limit should be left blank.
For parameters like surface roughness, position, concentricity and runout the Lower Specification Limit should be left blank.
For parameters like breaking strength, the Upper Specification Limit should be left blank.
SPC WorkBench correctly interprets Specification Limits left blank. It evaluates only Cpk/ Ppk (upper) for parameters that have only the Upper Specification Limit, and evaluates only Cpk/ Ppk (lower) for parameters that have only the Lower Specification Limit.
Process Capability Indices of Pp and Cp are undefined for parameters with unilateral tolerances.
What is a Pareto Chart? How will it help me in Attribute SPC?
|
A Pareto Chart is a pictorial representation of Vital few v/s Trivial many. SPC WorkBench plots a Pareto Chart for Attribute parameters where defect classification has been reported.
A Pareto Chart makes the defects that occur more frequently stand out, and channels your attention to these. You know from Pareto Analysis which defects need your attention the most. This way your problem solving efforts are channelized to the vital few defects that occur many times as against the trivial many that occur infrequently.
|
What are the steps in a typical Variable SPC implementation?
|
Variable SPC is performed when the quality parameter under monitoring is a measure that you can assign a numerical value to.
SPC WorkBench maintains the workflow such that it enables the correct effective practice of SPC. Typical workflow of a Variable SPC is as follows:
- Collect data in sub-groups and start plotting a Control Chart. A sub-group is a collection of readings for multiple individual samples. Plot the X-Bar chart and the Range Chart subgroup wise. A rational subgroup size is selected such that the readings in a single subgroup are representatives of the variation in the process at the instant the sub-group is sampled.
- When you believe that the process under monitoring has attained stability, apply Control Limits. This should be done typically after plotting at least initial 25 sub-groups of data. We call these the Process Study sub-groups.
- Control Limits are established based on the variation that is seen in these initial Process Study subgroups.
- To assure yourself that the Process is Stable and is working satisfactorily, verify that:
- All the Process Study points on the Control Chart fall within the Control Limits.
- The Process Capability Index Ppk for the Process Study data collected is satisfactory.
- These Control Limits applied should be carried forward. Continued stability of the process should be verified against these Control Limits.
- In course of running the process, there will be instances where a process improvement is made. The improved process will now run with a better repeatability. It would be prudent in such cases to re-apply control limits on the Control Charts based on the improved process horizon. The Control Chart will now monitor the process stability correctly for the improved process.
- As the process continues running, monitor the Histogram and the Process Capability parameters over a horizon window of your choice.
- The X-bar or X control chart being under control indicates that the process has maintained its center or location. The Range/ sigma chart being under control indicates that the process variation has remained consistent over the period of monitoring. Any out of control situations must be investigated and corrected before the process is allowed to resume.
- SPC WorkBench also captures trends in the data, and issues appropriate warnings. Such trends of drift must also be acted upon.
|
What are the steps in a typical Attribute SPC implementation?
|
Attribute SPC is performed when the quality parameter under monitoring is a Count of defectives or defects based on which you can classify output as good or not-good.
Attribute SPC is based on plotting p, Np, c or u charts. These charts being under control are indicators of stability of the process. Attribute charts are used as stated below:
- p Chart for fraction defectives
- Np Chart for number of defectives
- c chart for number of defects
- u chart for number of defects per unit.
A typical workflow for Attribute SPC is as follows:
- Collect samples of data for defectives or defects and plot a Control Chart. The sample size for attribute parameters is usually above 25.
- When you believe that the process under monitoring has attained stability, apply Control Limits. This should be done typically after plotting at least initial 25 sub-groups of data. We call these the Process Study sub-groups.
- Control Limits are established based on the variation that is seen in these initial Process Study subgroups.
- Continue monitoring the process based on the established mean of the control charts.
- A control chart being under control are indicators of stability of the process.
- Where defect classification is reported, SPC WorkBench will also display a Pareto Chart over the selected horizon window along the chart. A Pareto Chart makes the defects that occur more frequently stand out, and channels your attention to these. You know from Pareto Analysis which defects need your attention the most. This way your problem solving efforts are channelized to the vital few defects that occur many times as against the trivial many that occur infrequently.
|
What is traceability information? How can traceability information be used?
|
Traceability information is allied information about related aspects like toolings, fixtures, methods that may be relevant to the process. Each subgroup can be assigned with traceability information. It is organized as traceability category and traceability values for each category. SPC WorkBench automatically carries forward all traceability values of the last subgroup in a newly created subgroup. Traceability needs to be manually reassigned only when you want to change it.
SPC WorkBench gives you the facility of performing a filtered analysis. You can filter out data based on the combination of traceability values that you desire and draw out reports from it. This enables you establish possible cause and effects relationships on what works for you and what doesn't.
You could for example determine whether the Capability of a Process is better with a certain fixture, method or at a certain time of the day.
|
What are Event Logs? How is an Event Log useful?
An Event log enables you check in information with each subgroup. It could be information on batch numbers, any external event that has occurred or any other information that could be useful to go with the data.
Unlike traceabilities, Event Logs do not automatically get carried forward to the next subgroup. Event logs are specific to the subgroups they are applied to.
How is a filtered report generated? How is a filtered reports used?
SPC WorkBench gives you the facility of performing a filtered analysis. You can filter out data based on the combination of traceability values that you desire and draw out reports from it. This enables you establish possible cause and effects relationships on what works for you and what doesn't.
You could for example determine whether the Capability of a Process is better with a certain fixture, method or at a certain time of the day.
Traceability information is allied information about related aspects like toolings, fixtures, methods that may be relevant to the process. Each subgroup can be assigned with traceability information. It is organized as traceability category and traceability values for each category. SPC WorkBench automatically carries forward all traceability values of the last subgroup in a newly created subgroup. Traceability needs to be manually reassigned only when you want to change it.
Can I connect measuring instruments to SPC WorkBench?
|
Measuring instruments with digital output can communicate with computers. Such digital instruments output the measured readings on a Serial or USB interface. Instrument manufacturers also supply a data capturing software with such interface enabled instruments.
Such data capture software sits resident in the computer memory. When a reading is sent over the Serial or USB interface, the data capture software captures the reading and types it at the cursor location of whichever software is currently active on the computer. Data can be thus captured in virtually any application software including SPC WorkBench.
To capture data into SPC WorkBench specify the data entry mode as 'Manual Data Entry Mode'. All you need to do to capture data from a measuring instrument is to place the cursor in SPC Workbench data window where you want the reading to be. The capture software will seamlessly emulate the keyboard and place the captured reading at your cursor.
|
Can I import data from external sources into SPC WorkBench?
SPC WorkBench gives you a facility to copy and paste data as well as Traceability and Event Log information from MS Excel. SPC WorkBench can create a formatted worksheet in MS Excel based on the process structure. Once data is organized in this structure, it can be quickly copied and pasted into the current process.
Can I export reports to other data formats?
SPC WorkBench has its own reporting format which can be printed. In addition, the reports can be exported in several commonly used document formats. These include export to PDF, MS Word, MS Excel, MS PowerPoint, HTML, XML and a large number of picture formats.
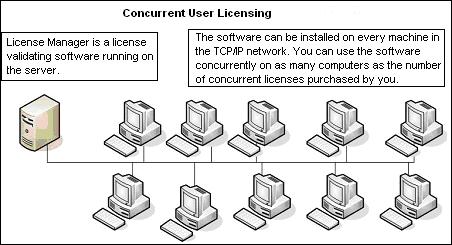
How is SPC WorkBench used in a Network?
|
SPC WorkBench data is stored in files with .spcx extension. These files can be stored and used over a network just like spreadsheets or document files. These files can be opened and used by SPC WorkBench running anywhere on the network.
SPC WorkBench can be licensed as a concurrent use floating license, where the number of computers running SPC WorkBench simultaneously are controlled.
With this licensing scheme SPC WorkBench can potentially be installed on every computer on the network and run without restrictions subject to the number of simultaneous computers allowed by the license.
|
|
Is the SPC WorkBench software validated?
SPC WorkBench is validated for accuracy of results by comparing the results with published data and from several authentic sources. Example files that are shipped with the evaluation version are some of the validation results.
I have special requirements that are not covered by SPC WorkBench.
SymphonyTech offerings include custom as well as standard software
We have a deep expertise in analytics related to Quality, Engineering and Manufacturing. This expertise has been brought home to our distinguished customers around the world through standard and custom software .
We can work with you to design, develop and implement effective solutions in our area of expertise. Please write to us for your requirements of MS Windows based as well as web based software solutions. Trust us to bring you the best.
What if my data does not follow Normal Distributions?
For all practical purposes we recommend that an eyeball test of whether the distribution has one peak and two tails is good enough for working with SPC. Capability predictions made under the assumption of Normality of data are usually more conservative and may err only towards safety. Control Charts too are known to be robust to non-normality. A minor departure of data from Normality can therefore safely be ignored.
How does SPC WorkBench detect trends and drifts in the process?
SPC WorkBench has the capability of detecting trends on Control Charts. We follow WECO (Western Electric) rules to monitor for drifts.
Does SPC WorkBench provide for access privileges to maintain data integrity?
You can define user privileges to allow access to SPC WorkBench. There are two types of Privileges supported SPC WorkBench:
Admin: The user with 'Admin' privilege can access all the functions of SPC WorkBench.
User: A User Privilege has an access to the extent of operating SPC WorkBench at operating level and in routine course.
You need Admin privilege to perform the following tasks:
- Perform User Management.
- Make E-mail Settings.
- Delete Data that is already committed.
- Change Default Data Location.
- Change sub-group data of sub-groups already committed.
- Exclude a sub-group.

 sign below to expand the answer.
