|
|
|
|
|
 SPC WorkBench is simple yet powerful software that enables you perform On-Line Statistical Process Control on the shop floor. |
|
Customers Worldwide
 Aikawa, Hungary
Bayer Healthcare, USA
Compass Technology, Hong Kong
Dynaroll Corp., USA
Sandvik Asia, India
Tata Motors, India
VisioCorp, UK Aikawa, Hungary
Bayer Healthcare, USA
Compass Technology, Hong Kong
Dynaroll Corp., USA
Sandvik Asia, India
Tata Motors, India
VisioCorp, UK
|
||||
|
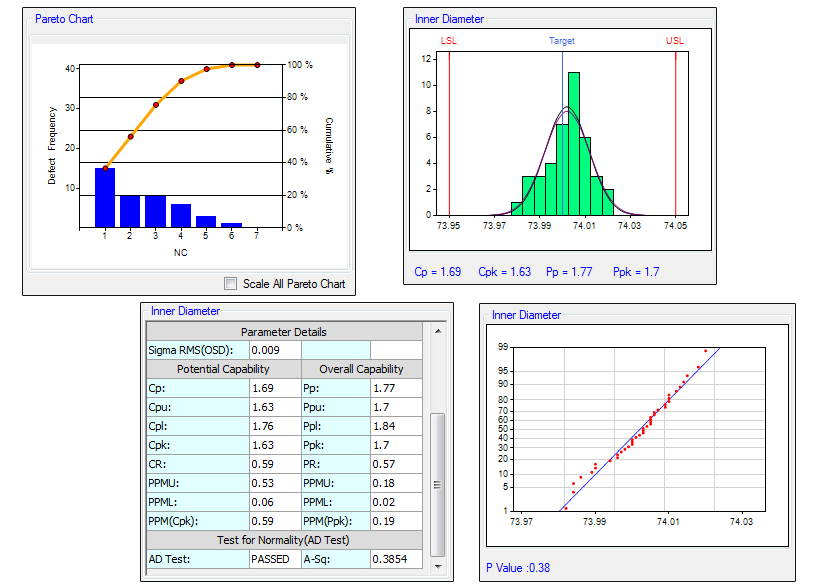
SPC WorkBench puts together Variable and Attribute Control Charts, Histograms and Capability Analysis, Pareto Diagrams, and all that is required to implement a math-anxiety-free SPC. |
|
|||||
| Features | |
Variable SPC
|

|
|
Attribute SPC
|
|
|
|
View Demo Videos hosted on the SymphonyTech website guide you through the workflow of using SPC WorkBench effectively. |
|
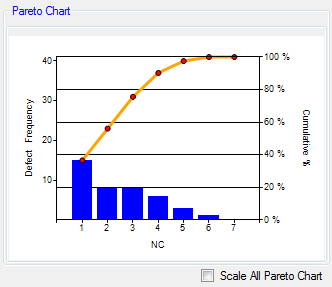
Pareto Diagram for Attributes
|
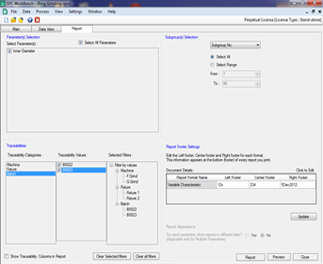
Report Builder for Stratified Reports
|
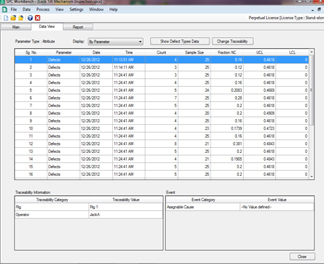
Data List View
|

|
| Also See: |
 Process Capability Wizard Process Capability Wizard
Process Capability of Normal AND Non-Normal Data |
 SPC Training Simulator SPC Training Simulator
SPC Training through Quincunx Simulator |
|---|
| Privacy Policy | EULA | © Symphony Technologies |
|