|
The funnel experiment is a mechanical representation of many real world processes at our places of work. The aim of the experiment is to demonstrate the losses caused by tampering with these very same processes. The primary source of this tampering is the use of Management by Results, reactions to every individual result.
In the experiment, a marble is dropped through a funnel, and allowed to drop on a sheet of paper, which contains a target. The objective of the process is to get the marble to come to a stop as close to the target as possible. The experiment uses several methods to attempt to manipulate the funnel's location such that the spread about the target is minimized. These methods are referred to as "rules".
Funnel Experiment Rule 1
|
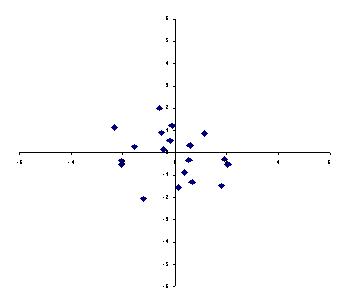
During the first setup, the funnel is aligned above the target, and marbles dropped from this location. No action is taken to move the funnel to improve performance.
This "rule" serves as our initial baseline for comparison with improved rules.
The results of rule 1 are a disappointment. The marble does not appear to behave consistently. The marble rolls off in various directions for various distances.
Certainly there must be a better (smart) way to position the funnel to improve the pattern !
|
Funnel Experiment Rule 2
|
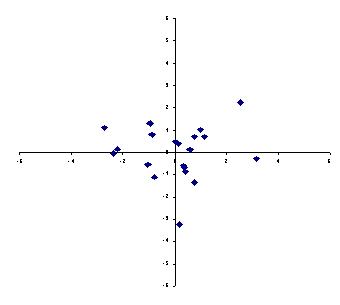
During rule 2, we examine the previous result and take action to counteract the motion of the marble. We correct for the error of the previous drop. If the marble rolled 2 inches northeast, we position the funnel 2 inches to the southwest of where it last was.
A common example is worker adjustments to machinery. A worker may be working to make a unit of uniform weight. If the last item was 2 pounds underweight, increase the setting for the amount of material in the next item by 2 pounds.Other real examples of Rule 2 include periodic calibrations. One checks a meter's measurement against a known standard, and adjusts the meter to compensate for the error against the standard. Many automated feedback mechanisms perform this adjustment continuously.
Other examples include taking action to change policies and production levels based upon on last month's budget variances, profit margins, and output. We also see this when setting next year's goals and targets based upon last year's levels.
|
|
Funnel Experiment Rule 3
|
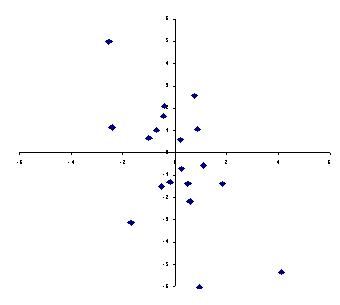
A possible flaw in rule 2 was that it adjusted the funnel from its last position, rather than relative to the target. If the marble rolled 2 inches northeast last time, we should set the funnel 2 inches southwest of the target. Then when the marble again rolls 2 inches northeast, it will stop on the target. The funnel is set at an equal and opposite direction from the target to compensate for the last error.
We see rule 3 at work in systems where two parties react to each other's actions. Their goal is to maintain parity. If one country increases its nuclear arsenal, the rival country increases their arsenal to maintain the perceived balance. If drug enforcement increases, prices rise due to increased demand, and drug runners have incentive to go to further lengths due to increased price.
A common example provided in economics courses is agriculture. A drought occurs one year causing a drop in crop output. Prices rise, causing farmers to plant more crop next year. In the next year, there are surpluses, causing the price to drop. Farmers plant less next year. The cycle continues.
|
Funnel Experiment Rule 4
|
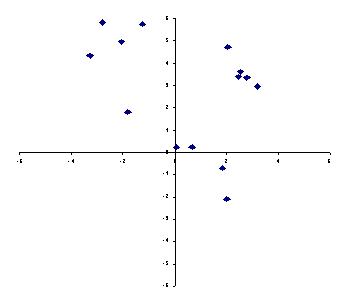
In an attempt to reduce the variability of the marble drops, we decide to allow the marble to fall where it wants to. We position the funnel over the last location of the marble, as that appears to be the tendency of where the marble tends to stop.
A common example of Rule 4 is when we want to cut lumber to a uniform length. We use the piece we just cut in order to measure the location of the next cut.
Other examples of Rule 4 include:
- Brainstorming (without outside help)
- Adjusting starting time of the next meeting based upon actual starting time of the last meeting
- Benchmarking, in order to find examples to follow
- A message is passed from one person to the next, who repeats it to another person, and so forth.
- The junior worker trains the next new worker, who then trains the next, and so forth.
|
|
Process Tampering
Rules 2, 3, and 4 are all examples of process "tampering". We take action (don't just stand there - do something!) as a result of the most recent result.
Rule 2 leads to a uniform circular pattern, whose size is 40% bigger than the Rule 1 circle. This is because the error in distance from the funnel is independent from one marble drop to the next. In positioning the funnel relative to the previous marble drop, we add the error from the first drop (by repositioning the funnel) to the second drop (the error in the marble).
The standard deviation of adding n independent random variables is the square root of n times the standard deviation of the individual. So the combined standard deviation is 1.4 times the original standard deviation. Note, this statistical principle is a standard question that appears on every Certified Quality Engineer exam in some form or another.
The problems of Rule 2 are corrected with "dead bands" in automated feedback mechanisms and better calibration programs. We wait for a certain error to build up before taking action. But how is the dead band determined? A control chart provides the answer. Plot the results on a control chart, and recalibrate (or give a feedback signal) when a statistically significant change is detected. Program "dead bands" approximate the control chart action.
Rules 3 and 4 tend to "blow up". In rule 3, results swing back and forth with greater and greater oscillations from the target. In rule 4, the funnel follows a drunken walk off the edge of the table. In both cases, errors accumulate from one "correction" to the next, and the marble (or system) heads off to infinity. Rules 3 and 4 represent unstable systems, with over-corrections tending to occur.
Conclusion
Schemes to control the location of the funnel should be control chart based. In addition, we may have to think "outside of the box" to fix this system. If we lowered the height of the funnel, we would fundamentally reduce the variation in the process. If we added more layers of cloth or paper to cushion the marble's landing, then the marble would roll less. The impact of these changes would be detected by the control chart, and would prove whether or not an improvement did occur.
Note: The graphs were made using an Excel spreadsheet pseudo-random number generator. It is not exactly the behavior of a marble, but is a reasonable approximation.
References:
- The New Economics for Industry, Government, Education, W. Edwards Deming, Chapter 9.
|
Author:
Steven S Prevette
Environment, Safety, Health & Quality
Fluor Government Group
ASQ Certified Quality Engineer
Published: November 2008
|
Steven S Prevette is a staunch Deming Disciple, a passionate statistician and ASQ Certified Quality Engineer. He works for Fluor Government Group.
He can be contacted at e-mail address: prevette@charter.net
or through us at info@symphonytech.com
|
|