
|
|
|
|
|
|
|
ProMSA is a Comprehensive Software for Measurement Systems Analysis (MSA) compliant with AIAG MSA Manual - 4th Edition.
Find out how ProMSA greatly simplifies the tedious MSA activities in your organization, while delivering all the power of complex statistics needed to comply with the AIAG standards. |
|
Customers Worldwide
 Caterpillar Inc., USA
Dana Corporation, USA
Mahindra & Mahindra, India
Mercedez Benz, India
Philips Semiconductors, Germany
Sumitomo Electric Wiring Systems, Europe
Toshiba Semiconductor Company, Japan Caterpillar Inc., USA
Dana Corporation, USA
Mahindra & Mahindra, India
Mercedez Benz, India
Philips Semiconductors, Germany
Sumitomo Electric Wiring Systems, Europe
Toshiba Semiconductor Company, Japan
|
||||||
|
Variable Studies:
See below: |
Click Here to View Attribute Gage Studies in ProMSA:
|
||
|---|---|---|---|
|
|
 Gage Repeatability & Reproducibility (Gage R&R) Study
|
|
R&R Study using 3 methods:
Advanced Control Chart analysis:
|
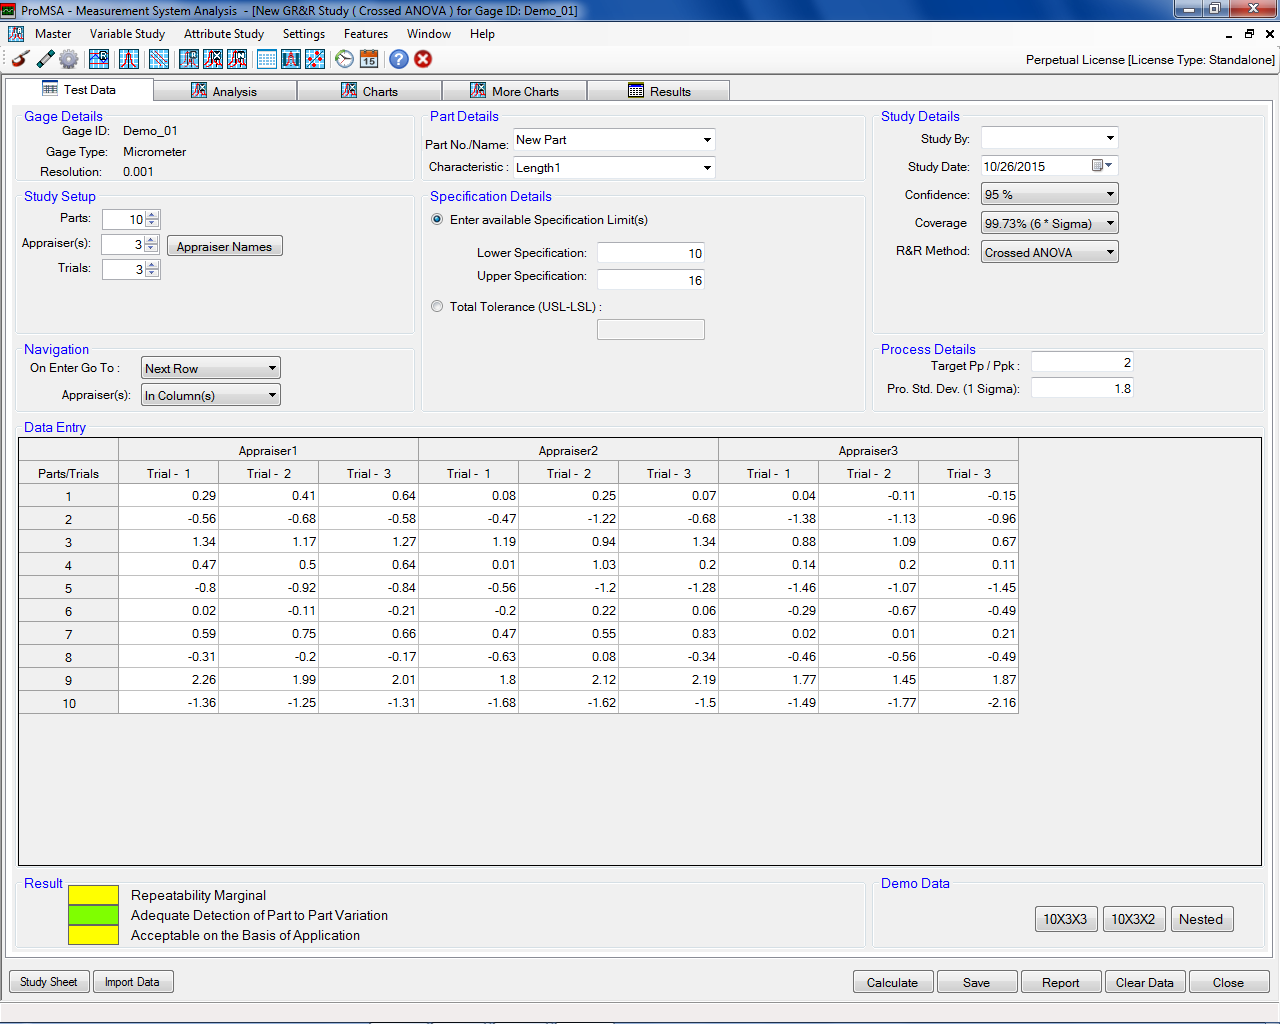
GR&R Data Entry Screen: Click to view more images |
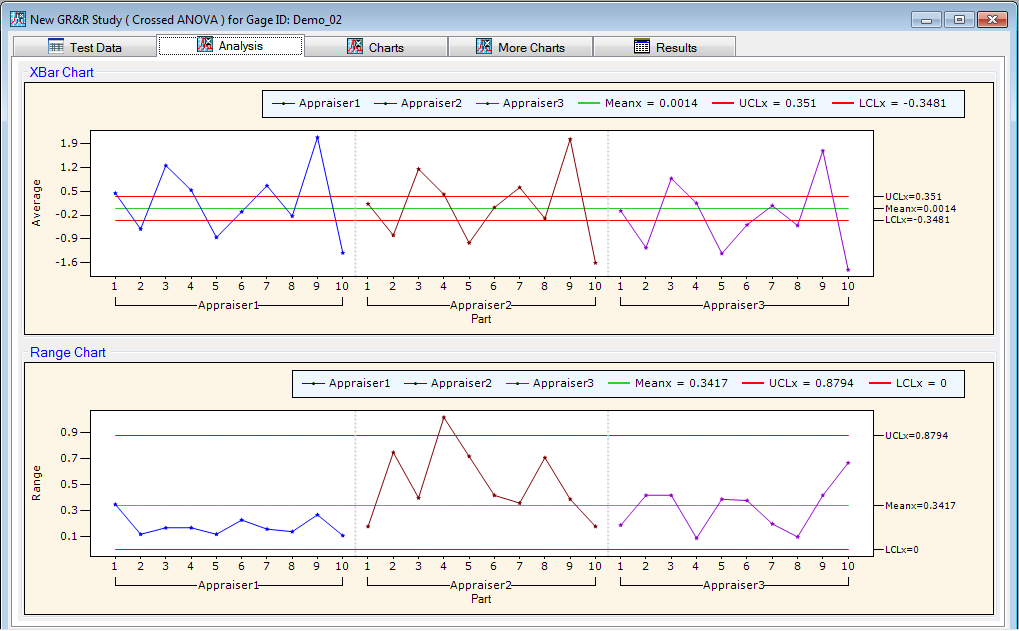
GR&R Graphical Analysis: Click to view more images |
Traffic signals for
|
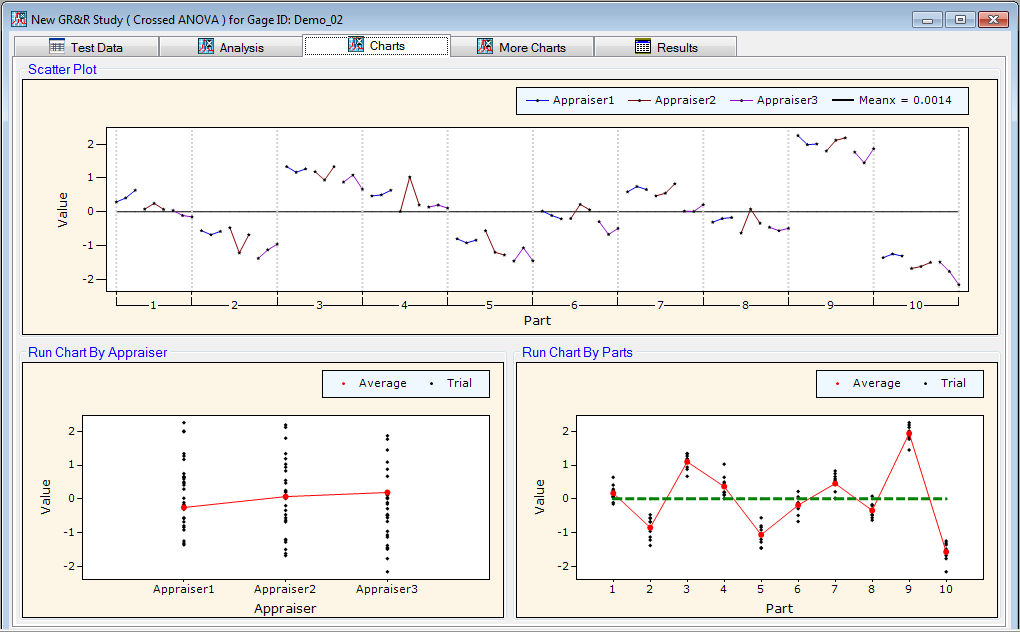
GR&R Graphical Analysis: Click to view more images |
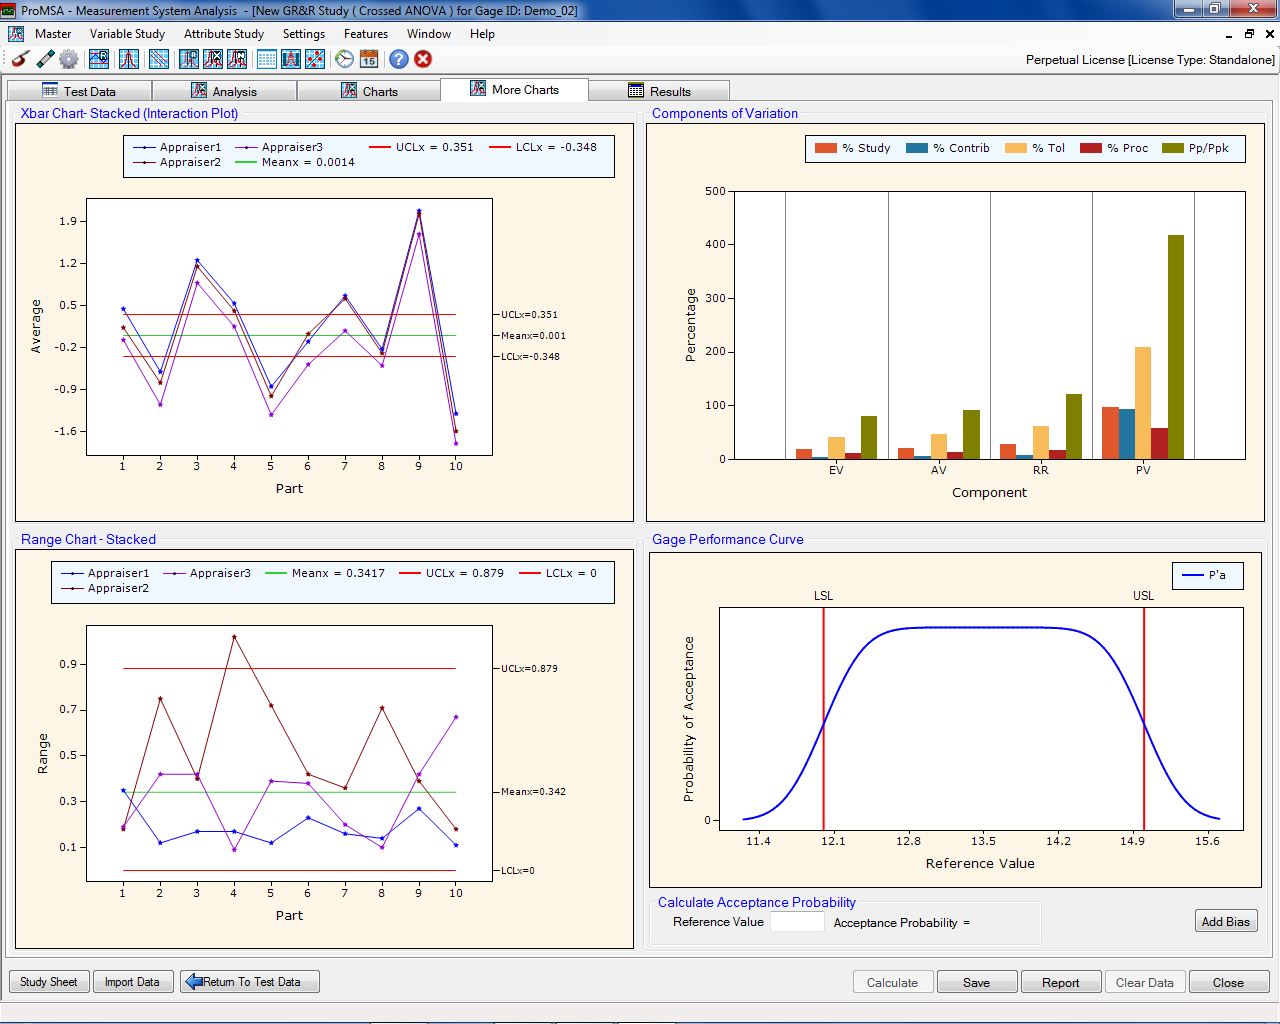
GR&R Graphical Analysis: Click to view more images |
 Bias Study
|
|
|
|
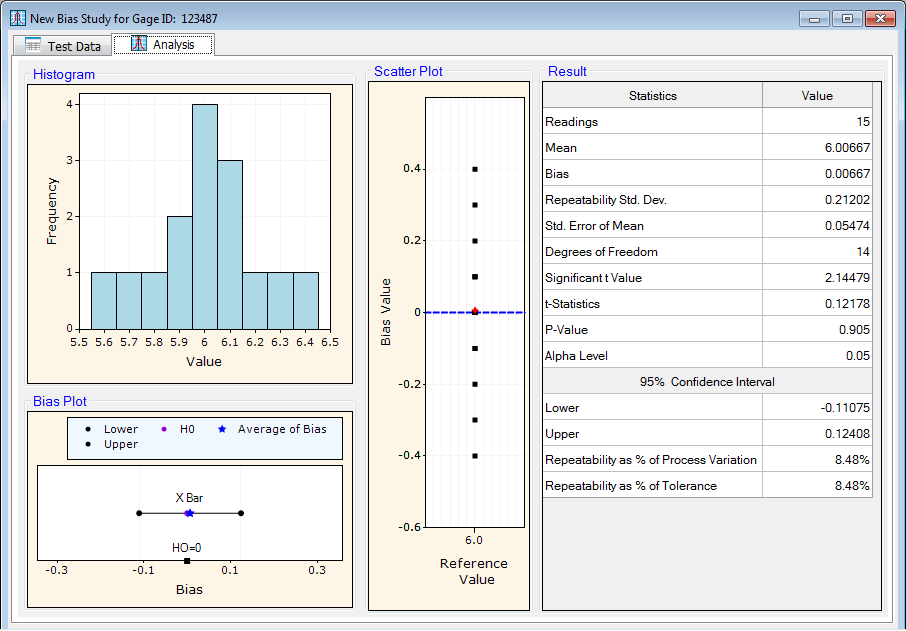
Bias Study Graphical Analysis & Results: Click to view more images |
 Linearity Study
|
|
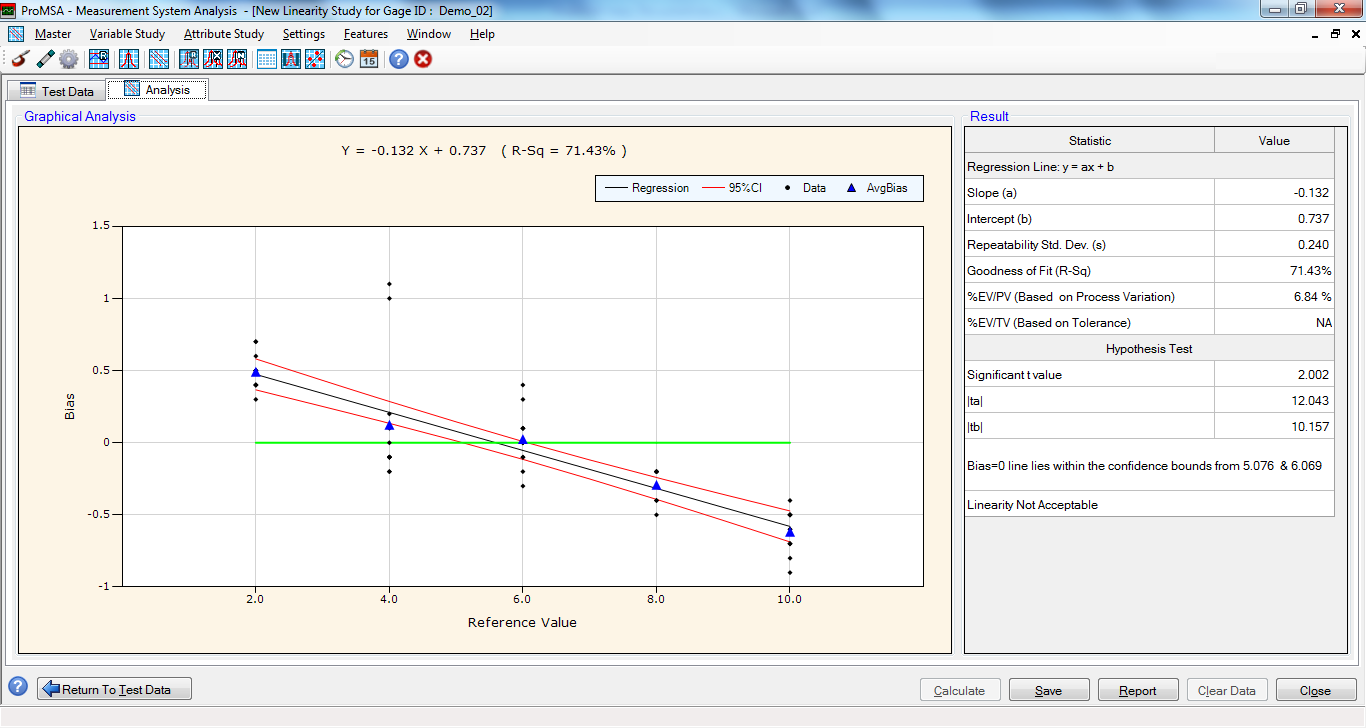
Linearity Study Graphical Analysis & Results: Click to view more images |
|
 Stability Study
|
|
|
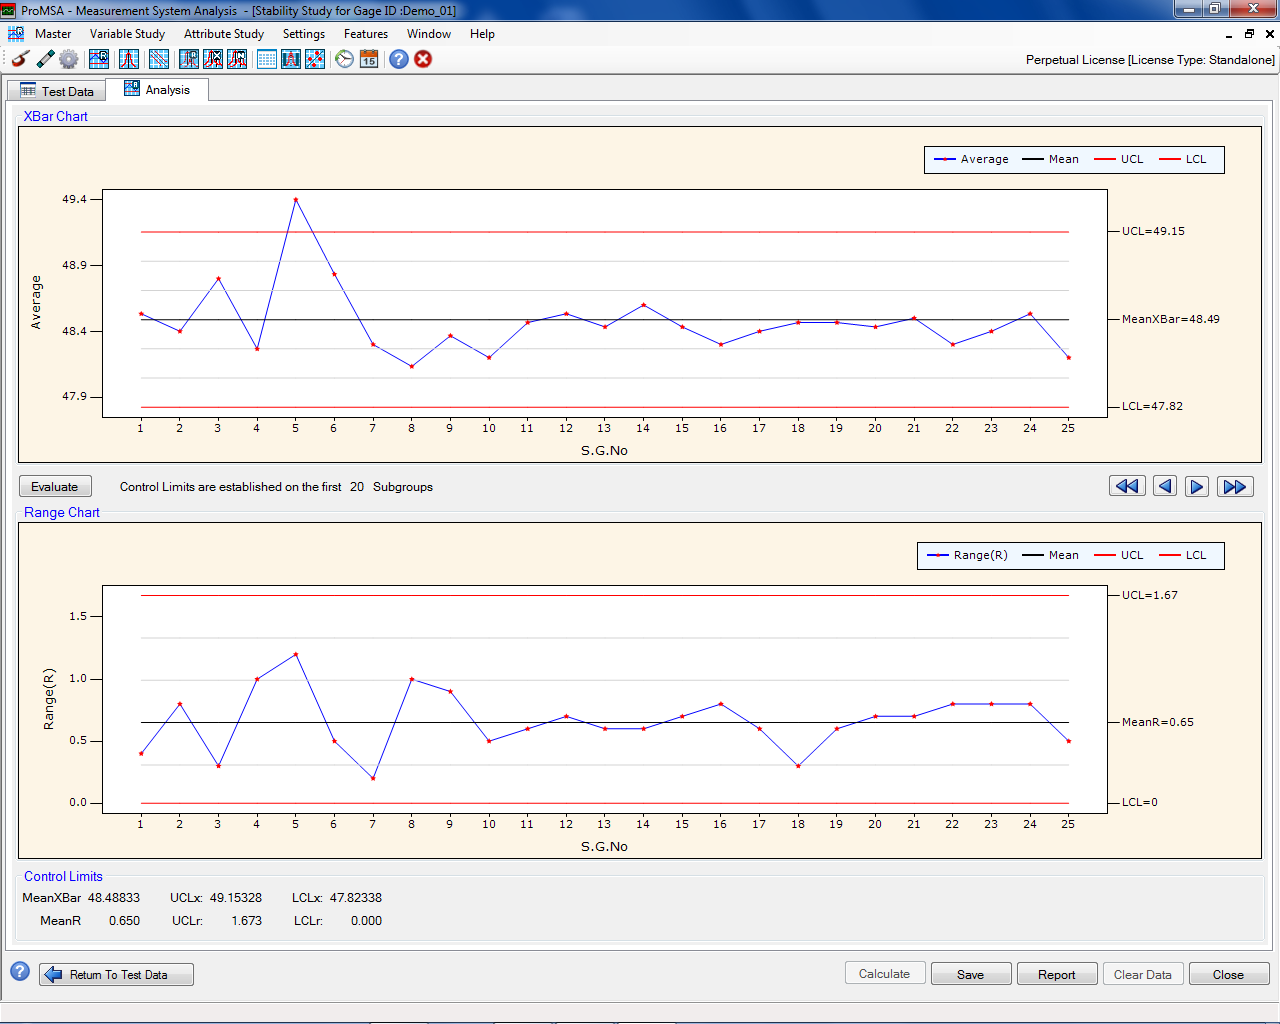
Stability Study Graphical Analysis: Click to view more images |
| Also See: |
 Freeware GR&R Calculator Freeware GR&R Calculator
for Automated Testing Equipments (ATEs) & CMMs & More... |
View Attribute MSA Features in ProMSA |
|---|
| Privacy Policy | EULA | © Symphony Technologies |
|
&bText=msa_en.zip&cText=proico.gif&dText=promsa)