A case for Appropriate Tolerancing
Dr. C. G. Darwin, Director of the British National Physical Laboratory narrated his classic experience on the subject of tolerancing.
'... It looked as if some tolerances were assigned much closer than should be necessary., and I started to try and find out how they had been fixed ... To exaggerate the picture which I got as a result of my inquiry, I concluded that in designing a new machine, the chief engineer drew it freehand with dimensions to the nearest inch, and sent it to the draughtsman to work out the detail to the nearest thousandth, who then gave it to his junior assistant to mark in the tolerances. Instructions were certainly always given that the tolerances should be as easy as possible, but only lip service was done to them, and the junior assistant, anxious not to get himself into trouble, would, as a general rule think of the smallest number he knew and then halve it ...'
Look around you... Do you see this happen every day?
It is very easy to tighten tolerances, and theoretically, Quality can be improved to any extent doing this. Unfortunately, it is also associated with an increase in costs. As Thomas Barker puts in his book 'Engineering Quality by Design', it is a common practice to throw money at the problem. Tightening the tolerance to produce the desired quality could up-cost the design by a factor of four!
Tolerances on process parameters
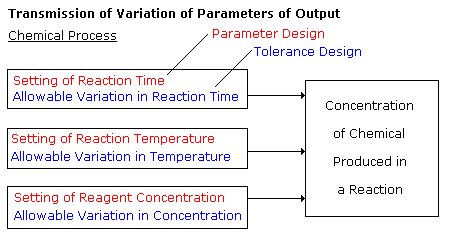
Tolerances as popularly projected are not necessarily dimensional tolerances on products or components alone. Tolerances on Process parameters have a bearing on the variation in the output Quality of the product that comes out of the process.
Tolerance design needs to take into account:
- Selection of Parameters' Nominal Level.
- Selection of Tolerance (allowable variation) around that Level.
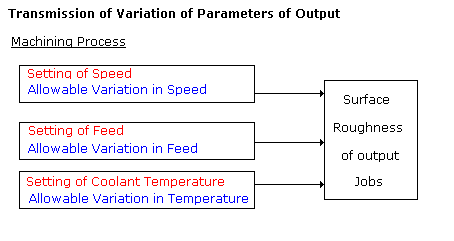
Variation in output from a process is determined by a combination of variations in multiple parameters that govern the process. The figures below will illustrate the point.
Scientific Tolerance Design takes the advantage of the following two facts.
|
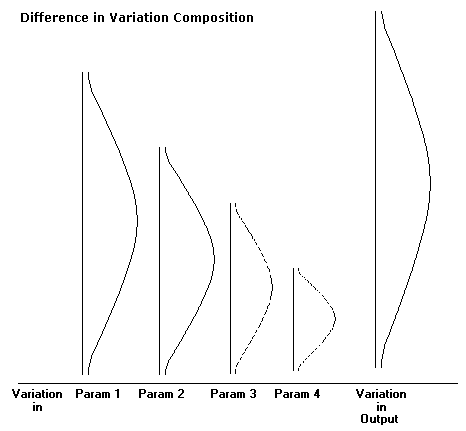
1. Extent of Variation transmitted by every contributing parameter to the output of the process is different. For example, a shaft machining process is affected by speed of machining, feed and coolant temperature. However, all these parameters will not have an
equal amount of effect on the variation of size of machined shafts the process produces. This is illustrated by the following figure.<
The figure shows that only a very few parameters really contribute significantly to the variation that is observed in the output. This variation transmitted can be measured easily by performing sensitivity analysis on each of the parameters. Thus we find that in any process, only around 20% of the total parameters need to be assigned closer tolerances. The extent of this closeness of tolerance too will be determined by careful calculations of variation transmission, and tolerances applied only as close as necessary. Any further tightening of tolerances will not give returns in terms of Quality, but will certainly add to the costs.
|
|
| |
|
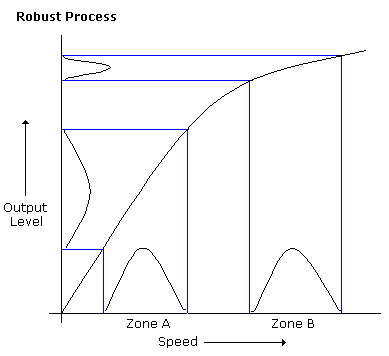
2. Variation transmission ratio is not the same across all levels of settings of contributing parameters. This point can be illustrated by the following figure that is commonly used in all literature on robust design.
You will observe that speed variation around level B has very little effect on the output variation as compared to the same speed variation around level A. The setting of the contributing parameter of speed to level B therefore makes the process more robust to process parameter variation.
|
Quality, after all is all about delivering goods as close as possible to the customer's expectations and with a low variation around the expected level.
Measurement of variation transmission for appropriate tolerancing
The mathematics and statistics that goes into measurement of variation, and variation transmission is beyond the scope of this article. We will however discuss the logic that goes into such measurements.
The parameter design ( or design of levels of parameters) can be achieved through planned experimentation where the levels of various contributing parameters of a process are changed in a planned manner. Observations in systematic change in the desired output parameter help to determine the best levels of each contributing parameter.
The discussion will be incomplete without a reference to Taguchi methods that not only examine the parameter design but also the tolerance design around the parameter levels.
Dr. Taguchi recognizes the fact that the quality of a product or service depends on getting the nominal value of deliverables as close as possible to the customers' specifications, and also delivering consistently at that level. He therefore defines a concurrent measure, the S/N Ratio ( Signal-to-Noise Ratio) to measure the goodness of a process. The S/N Ratio rewards a process for being close to the customers' expectation, and penalizes variation from nominal. In planned experimentation, in each run, deliberate variation of tolerance size is introduced. This is defined as a Noise Matrix. The S/N Ratio monitors the effect of the noise (deliberate variation around the nominal) on each run, and highlights the settings of parameters that transmit least amount of parameter noise to the output.
Variation composition analysis is also done by running sensitivity analysis through planned experimentation.
Though detailed treatment of the statistical analysis that goes into Parameter and Tolerance design is not discussed, it would be important to note that the result of such analysis almost always results in process cost reduction.
Cost Reduction for Free
Cost reduction can be achieved by loosening the tolerances on expensive parts and processes and making compensating changes in inexpensive ones.
Loosening tolerances on processes that are found to be contributing minimally to output variation would lead to further cost savings.
In cases where proper tolerances have not been applied to critical and important parameters, appropriate tolerances can be applied based on variation composition analysis, and rejection of output can be avoided, thus saving costs.
The techniques of Scientific Tolerancing thus lead to lowering of costs, improvement of Quality, and Robustness of Application, for products and processes. All this is achieved without expending any additional resources of incurring additional costs. It is done purely through conscious and scientific analysis of variation and variation transmission.
Lowering of costs without expending substantial resources leads to improvement in profits at the bottom line.
Detailed references are of the techniques and methods are available in the literature mentioned at the end of this article. I too would be happy to discuss detailed techniques of such analysis with anyone who is interested and has specific cases and goals in mind.
References:
- Statistical Quality Control - E.L. Grant
- Engineering Quality by Design - Thomas Barker
- Optimization and Variation Reduction in Quality - Wayne A. Taylor
Author:
Ravindra Khare
Symphony Technologies Pvt. Ltd.,
B-4, Saket, Vidnyan Nagar, Bawdhan,
Pune 411 021, INDIA
Published: May 2001
|
Ravindra Khare is a Founder and Director of Symphony Technologies. He is a qualified Mechanical and Industrial Engineer and a keen student of Quality & Productivity Technology for the past 18 years.
He can be contacted at e-mail address: ravi@symphonytech.com
or through us at info@symphonytech.com
|
|